Visualizing my research interests
Updated:

Seeing beyond the CV
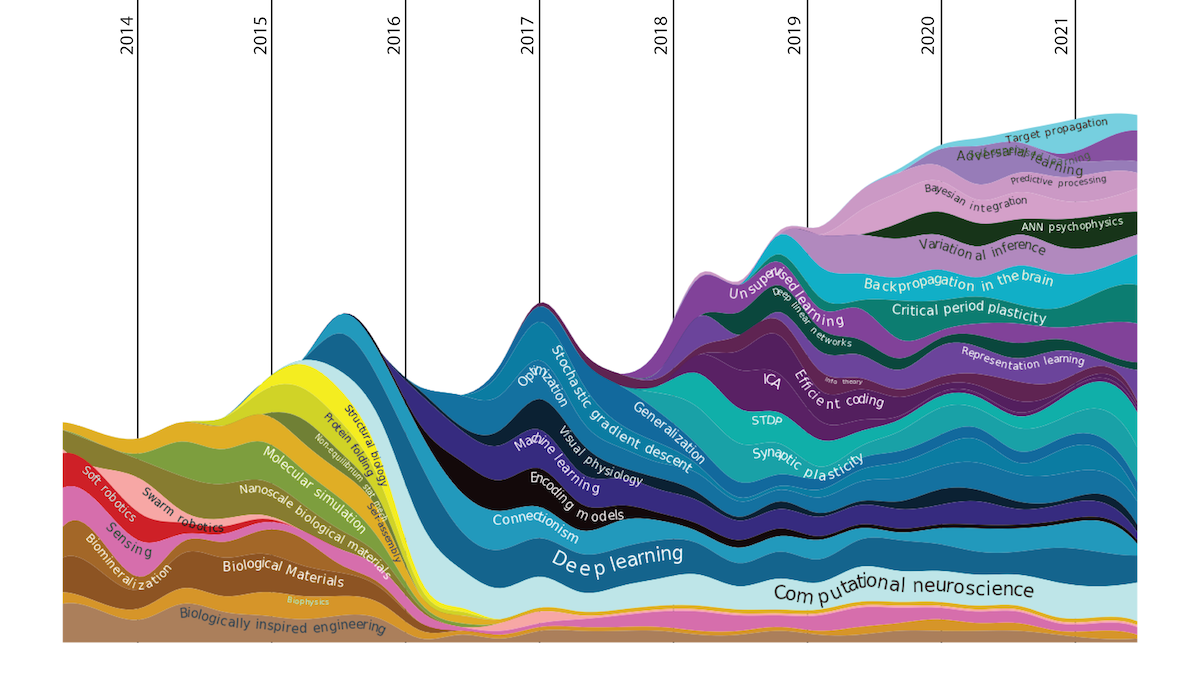
In a book of work by Studio Gang, a brilliant architectural firm led by Jeanne Gang, there is a sketch of the studio’s themes and interests over time, mapped out in pencil just like the figure above. I thought it was brilliant, both an exercise and as a communicative device.
At the same time I was also recreating my CV, as required by my department, and I was feeling disappointed by the linearity and flatness of the format. And so as an exercise in communication and introspection I decided to make my own. But not in pencil – in code.
Making colors represent topic similarity
I knew immediately I wanted color to represent the similarity between my academic interests. Without that cue, the 30+ interests of mine would fade into each other.
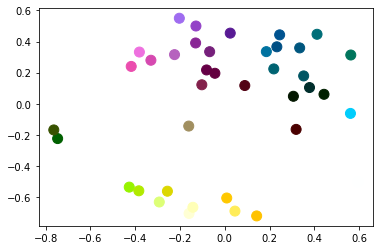
Instead of choosing colors by hand, I felt it would be easier to map the similarity of my interests directly into color algorithmically. This involves three steps:
1) Make a similarity matrix for each interest. 2) Use this matrix to create a 3D embedding of my interests that preserves distances as best as possible (using MDS, multidimensional scaling). 3) Interpret the 3D embedding as locations within a 3D color space in which Euclidean distance corresponds to perceptual similarity. I chose the CIELAB color space.
